
Graphics won't post. See the charts here.
Here are the numbers as best I can eyeball them from the chart:
Clinton S&P: 420 to 1,300
Bush: S&P 1,380 to 1,360
Clinton: DOW 3,200 to 10,500
Bush: DOW 10,700 to 12,200
With a little more checking I see that this sort of record has long been the case. This is very interesting too:
Republicans Aren’t Even Good for the Rich
Excerpt:
"United States Census Bureau data on mean household income from the beginning of the Nixon Administration through 2002 (the last year for which these data are currently available) show that this almost universally held belief is simply, almost spectacularly, wrong. During that period, Republicans held the White House for 22 years and Democrats for 12 years. In constant 2002 dollars, the average annual gain in income by the richest five percent of American households under Republicans (Nixon, Ford, Reagan, and the two Bushes) was $1706. Under Democrats (Carter and Clinton), the richest five percent saw their income rise by an annual average of $6,921."
"During the same administrations, from Nixon to the second Bush, the Dow has gained an annual average of 7.1 percent under Republican administrations and 11.1 percent under Democrats. Here, too, the difference is more striking when the comparison is limited to the two Bushes and Clinton: a 6.7 percent gain under the Bushes and a 16.8 percent gain under Clinton."
UNDER WHICH PARTY DO THE RICH FARE BETTER?
Since 1968 (Nixon Through G.W. Bush)

Since 1988 (The Two Bushes Compared with Clinton)

"Republicans have traditionally identified themselves as the party of fiscal discipline, but over the last three-quarters of a century, Republican administrations have increased federal debt at a rate more than four times faster than have Democrats. (This statistic, moreover, includes a decade and a half of combating the Depression and fighting World War II under Democrats and does not include this year’s record Republican deficit of more than $400 billion.) A comparison of the presidencies of the two Bushes and Clinton in the area of fiscal responsibility is especially dramatic. The average annual deficit under Clinton was $40 billion. Under the Bushes (again, not yet including this year’s $400-plus billion deficit), the federal government has gone more deeply into debt at the rate of $256.3 billion per year, meaning that deficit spending has been more than six times worse under the Bushes than Clinton--and that difference grows greater by the day." [note: these are 2004 numbers)
"What of overall economic growth? During the period from Herbert Hoover's presidency onward, the American economy (GDP) has grown nearly three times as fast under Democrats as Republicans. (The annual mean growth in real GDP under Republican Presidents has been 1.8 percent; under Democrats, 5.1 percent.)"
See the rest here.
DAR
Will we ever see a republican on this forum with the courage to defend such a record?
More:
See this chart too
***
And even longer and more thorough comparison:
Voting With Your Wallet: Breaking Down the Numbers by Party
By Philip Davis
posted on: October 16, 2006
1950-1953: Truman -- D (two assassination attempts) inherited a post-war economy in charge of building the country back up from a very difficult period. The 1948 election was the first time the Republicans attempted to steal an election by miscounting ballots: S&P 16-26
1953-1961: Roosevelt's Great republican general, Eisenhower -- R got us through the Korean War and got the 60s off to with a bang by starting the cold war that set the stage for the an immense peacetime expansion of the military -- one might say he invented the Fear Factor! S&P 26-58
1961-1963: Kennedy -- D (assassinated) inherited the Cuban missile crisis from Ike, but turned things around quickly: S&P 58-71
1963-1969: Johnson -- D declared war on poverty, started Medicaid but, unfortunately, also let us get sucked into Vietnam: S&P 71-104
1969-1974: Nixon -- R (scandal) I'm not even going to go there! S&P 104-86
1974-1977: Ford -- R The most amazing thing about Ford is that he became President of the United States of America and only 100,000 people ever voted for him in Michigan! S&P 86-96
1978-1982: Carter -- D A better ex-President than President, but a better President than he gets credit for during a really tough time. S&P 96-150
1982-1989: Reagan -- R Even I love him as a person, but he mortgaged the country to make the economy look good and effectively created our national debt as we went from a credit balance to a $3T deficit under his regime. Bush I's CIA sold arms to Iran! S&P 150-339
1990-1993: Bush I -- R Settled a lot of old CIA scores (Panama, Gulf War), pardoned the contra crowd, continued "Voodoo Economics" to over $4T in debt. S&P 339-445
1994-2001: Clinton -- D balanced the budget and attempted to nationalize health care before costs got out of control. Turned the actual (not fantasy) economy around and generated a surplus. His big mistake was to raise taxes on the wealthiest 1.2% of the taxpayers to balance a cut for 15M low-income families and 90% of American small businesses. This drove record funds into the 1994 Republican election where the Democrats lost the House and the Senate. S&P 445-1350
2002-???: Bush II -- Took a $2.6T budget surplus and turned it into a $1.5T deficit within 6 months of taking (literally) office by giving the average American family $3,000 (for gas) and above average American families millions. Holds the presidential record for cabinet resignations (14), and is the first President to suspend the release of presidential papers. The S&P was already down to 1,073 on 9/10/01 and, in fact, "only" dropped to a low of 944 on 9/17 before rebounding to 1,091 by early October. The rest of the drop -- to 794 over the next 12 months, was just the result of terrible economic policies. Last week was the first time the S&P got back to Clinton levels.
So how does that all stack up on the overall economic scorecard of Democrats vs. Republicans?
According to the U.S. Bureau of Economic Analysis:
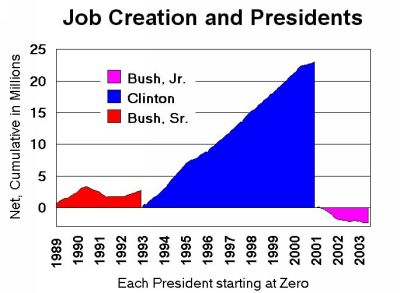
* Personal income grew 20% faster under Democratic Administrations.
* Employment averaged 30% more under Democratic Administrations.
... I'm not going to keep saying under Democratic Administrations unless the Republicans win a category...
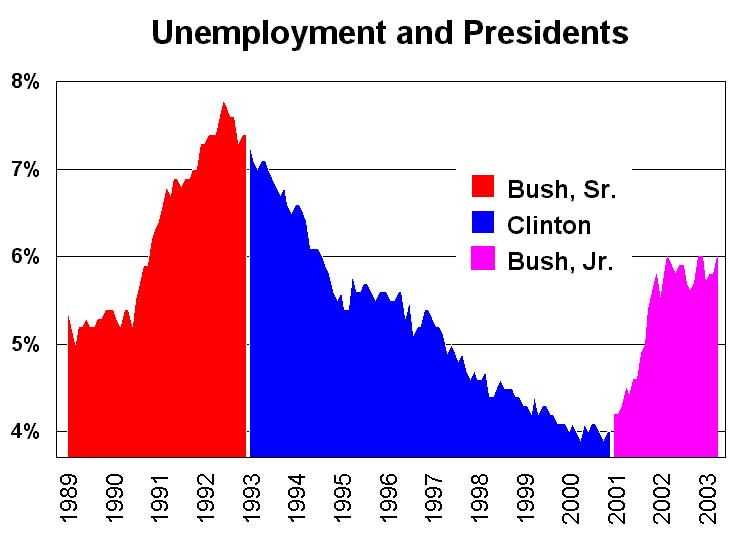
* Unemployment was 30% less (makes sense).
* GDP grew 33% more from 1962 on (see lag factors too!)
* GDP growth since 1930 was a stunning 5.4% vs 1.6%
* Inflation was 15% less, 27% less with lag factors.
* Growth in Federal spending (now hold onto your hat) 7% under Democrats, 7.5% under Republicans through 2001 (Bush will blow this number up a mile).
* Growth in Defense spending 8.3% Dems, 10% Reps
* Rise in Federal employees -- Republicans hired 310,000 new ones vs. Dems just 59,000.
* Average annual budget deficit 1962-2001: Dems $36B, Reps $190B (another number Bush will increase substantially)
* Total debt increase 1962-2001: Dems $720B, Reps $6.3T (again, Bush will lead you to the $7T promised land -- 10x what the Dems have done!)
* Average annual stock market returns since since 1900: Dems 12%, Reps 8%
* With a Democratic Senate: 10.5%
* With a Republican Senate: 9.4%
* With a Democratic House: 10.9%
* With a Republican House: 8.1%


